Dashboard
nShield Monitor provides a dashboard view when you first log on to the system.
This view provides a snapshot of what is occurring with your estate and provides invaluable information for the day-to-day management of all your organization’s HSMs.
The contents of the dashboard depends upon logon type:
-
Logged on as Administrator.
-
Logged in as Group Manager.
The following table summarizes the views based on log-on type:
Dashboard views based on logon type
| Dashboard Views | Administrator logon required | Group Manager logon required |
|---|---|---|
Event List |
X |
X |
nShield Performance |
X |
|
Users |
X |
|
nShield Monitor Status |
X |
X |
Unacknowledged Alarm Summary |
X |
X |
| The sections that follow examine each of the Dashboard Views (as identified in the table above). |
Event List
-
Select the Event List expansion arrow.
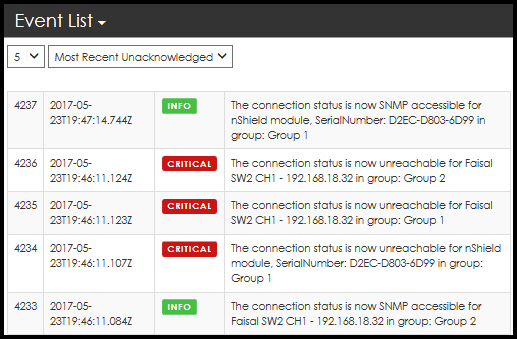
From this window, you can specify the number of events (default value is 5) displayed and filter according to:
-
Most Recent Unacknowledged (default value)
-
Most Recent Events
-
Alarm level (That is, EMERGENCY ONLY, ALERT ONLY, and so on.)
-
-
Select the drop down arrow to expand your choices for number of events displayed.
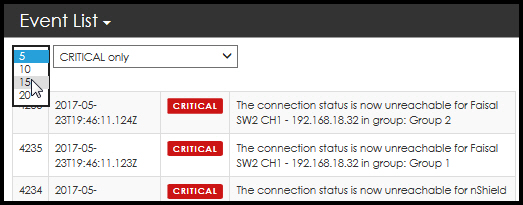
-
Select your preference.
-
Select the drop down arrow to expand your choices for event types.
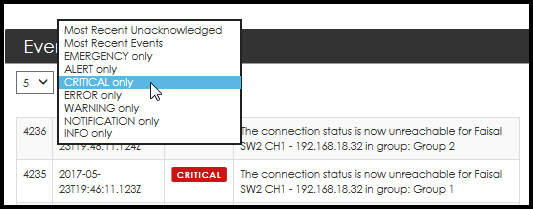
-
Select your preference (for example, CRITICAL only.)
-
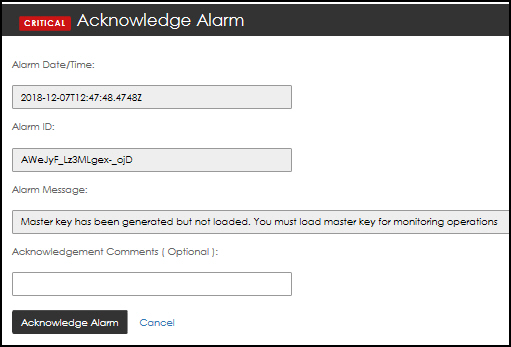
Select the event by clicking on the event type. For example:
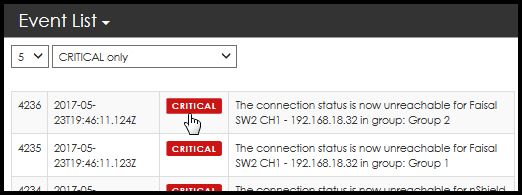
The Acknowledge Alarm page opens:
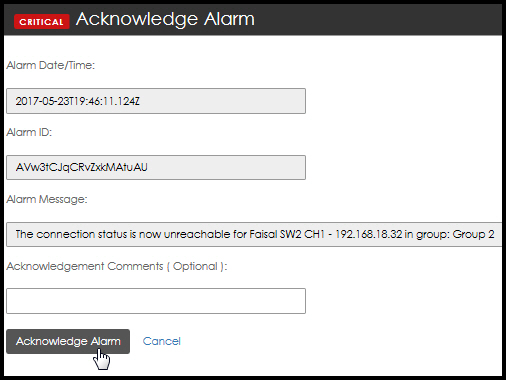
-
Enter Acknowledgment Comments, if needed.
-
Select Acknowledge Alarm.
Selecting Cancel returns you to the Dashboard.
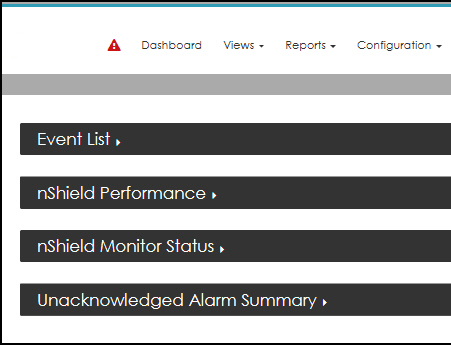
nShield Performance
| You are logged in as a Group Manager. |
-
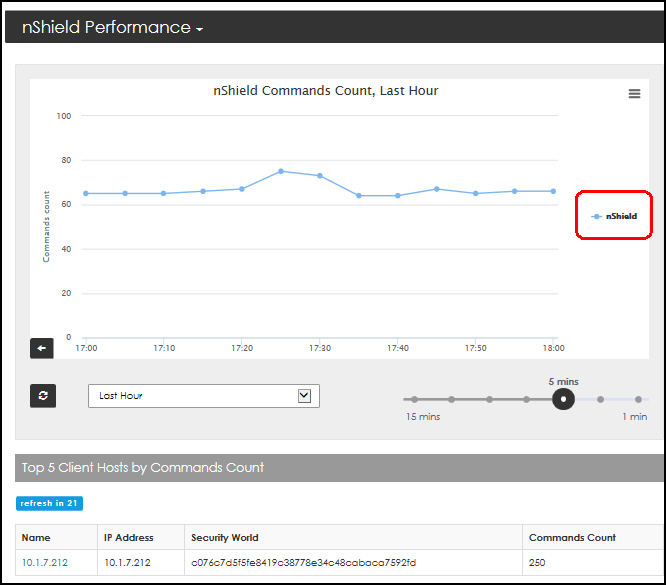
Select the nShield Performance expansion arrow.
Two windows open:
-
nShield Performance
-
Top 5 Client Hosts by Command Count
-
nShield performance window
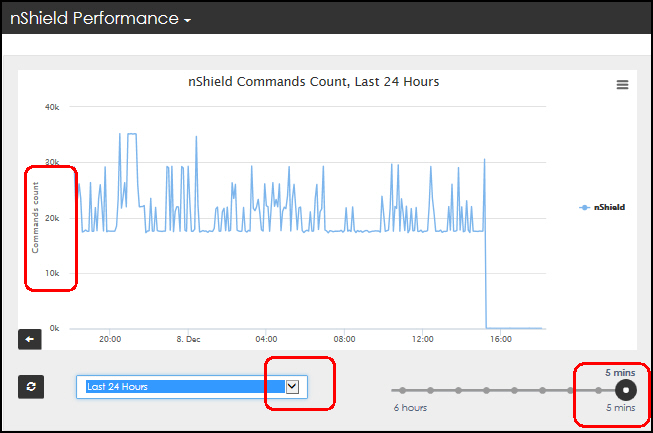
The performance window provides a customizable graph.
This section provides a basic overview on how to use the customization options. Refer to Client Host Detail Page for greater detail.
Navigate to a group’s Detail page
At any time, you can open a specific group’s Detail page. A color key on the right side of the graph contains Group color line assignments. For example, the "nShield" group, circled in red above.
Clicking on Group 1’s graph contents opens the Group Detail For: Group 1 page.
Refer to Group Details for a full description of the Group Details page.
Top 5 Client Hosts by Commands Count
This window also contains a live count down until the next refresh. In the example below, the data will refresh in 24 seconds.
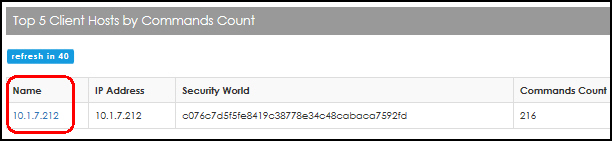
-
Select an entry in the name list to navigate to additional windows of data.
The Client Host Detail page opens.
-
Select the Performance expansion arrow.
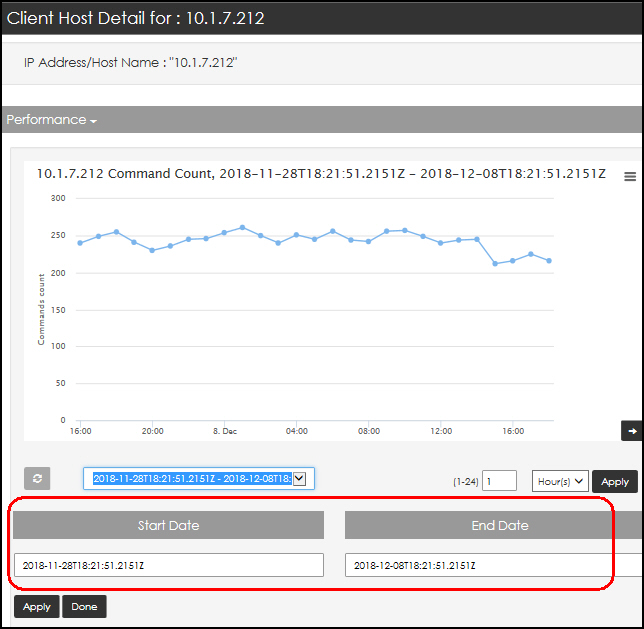
The Start Date and End Date selection boxes appear when the custom date option is selected.
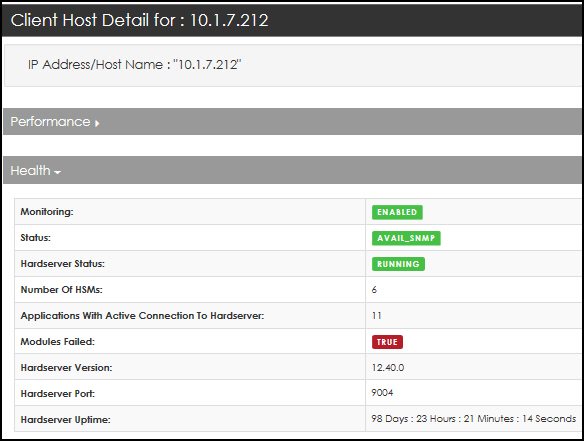
-
Scroll down and click on the Health expansion arrow.
-
Scroll down and click on the Applications with Active Connection to Hardserver expansion arrow.
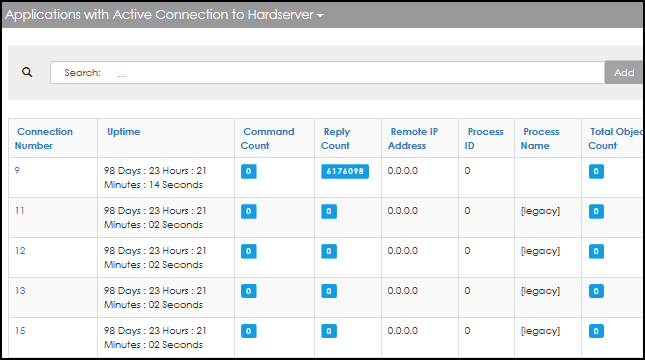
-
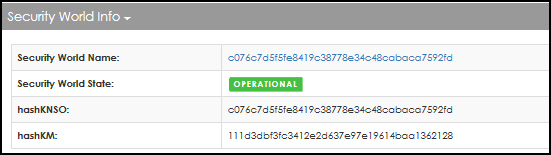
Scroll down and click on the Security World Info expansion arrow.
-
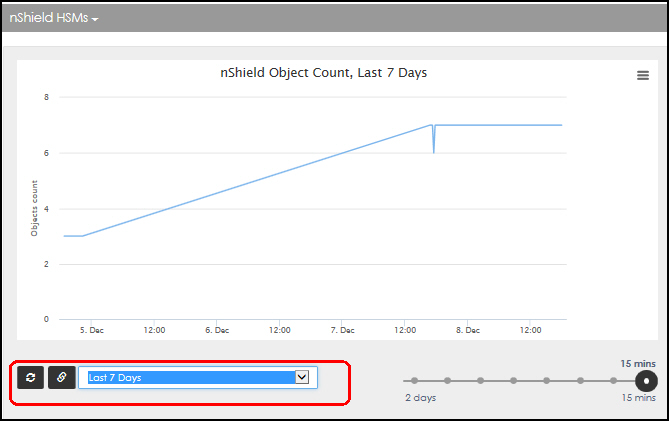
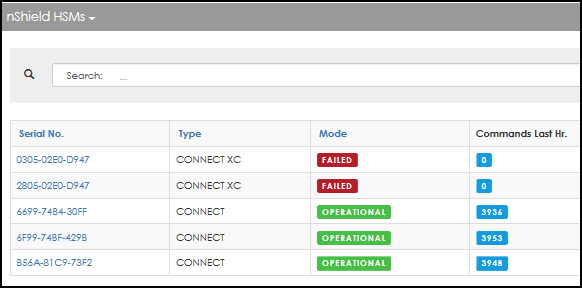
Scroll down and click on the nShield HSMs expansion arrow.
-
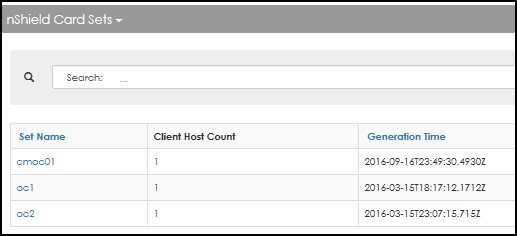
Scroll down and click on the nShield Card Sets expansion arrow.
-
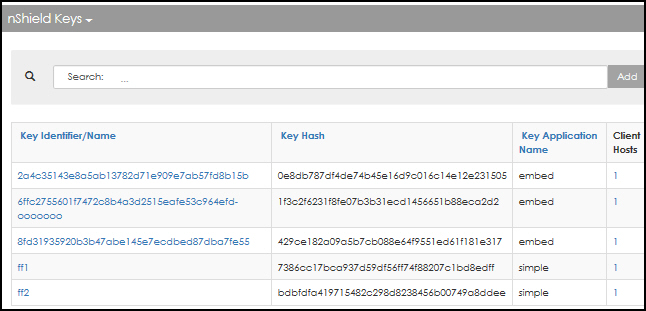
Scroll down and click on the nShield Keys expansion arrow.
At any time, you can select Back to Previous Page.
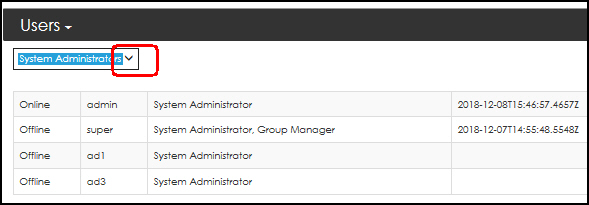
Users
| You are logged in as an Administrator. |
-
Click the Users expansion arrow.
-
Select the drop down arrow to open the filtering options.
-
Select your preferred view. Filters include:
-
System Administrators
-
Group Managers
-
System Auditors
-
Last 5 login
-
Locked Out
-
The display reflects your selected filter option.
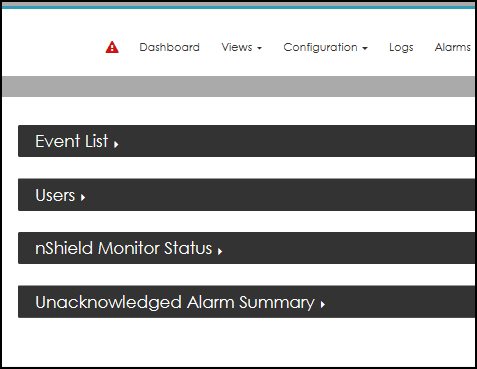
nShield Monitor Status
| You are logged in as an Administrator. |
-
Select the nShield Monitor Status expansion arrow.
The status data is displayed.
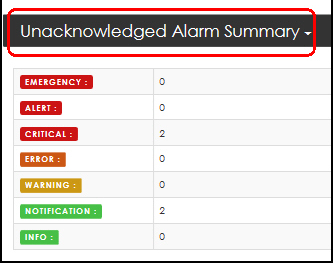
Unacknowledged Alarm Summary
| You are logged in as an Administrator. |
-
Select the nUnacknowledged Alarm Summary expansion arrow.
-
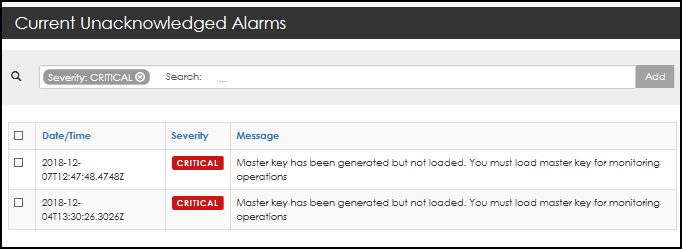
Select the alarm type. For example, click on CRITICAL. The Current Unacknowledged Alarms detail page opens.
-
Select the alarm for acknowledgment.
-
Enter Acknowledgment Comments, if required.
-
Select Acknowledge Alarm.
From the Current Unacknowledged Alarms window, you can also click on the severity type (for example, click on CRITICAL), to open the Acknowledge Alarm window.