Dashboard
nShield Monitor provides a dashboard view when you first log on to the system.
This view provides a snapshot of what is occurring with your estate and provides invaluable information for the day-to-day management of all your organization’s HSMs.
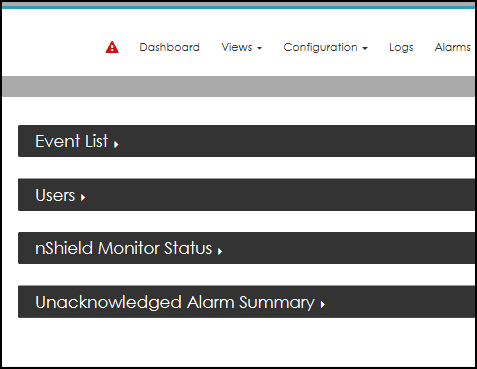
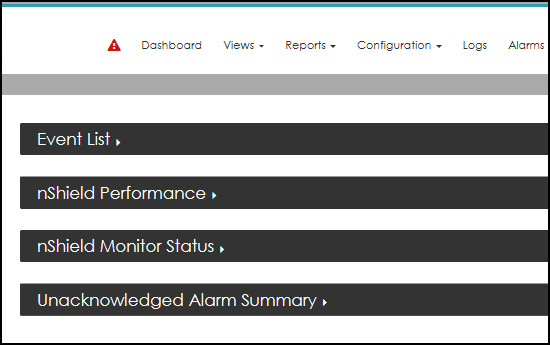
The contents of the dashboard depends upon logon type:
-
Logged on as Administrator.
-
Logged in as Group Manager.
The following table summarizes the views based on log-on type:
Dashboard Views based on Log-on Type
| Dashboard Views | Administrator logon required | Group Manager logon required |
|---|---|---|
Event List |
X |
X |
nShield Performance |
X |
|
Users |
X |
|
nShield Monitor Status |
X |
X |
Unacknowledged Alarm Summary |
X |
X |
| The sections that follow examine each of the Dashboard Views (as identified in the table above). |
Event List
-
Select the Event List expansion arrow.
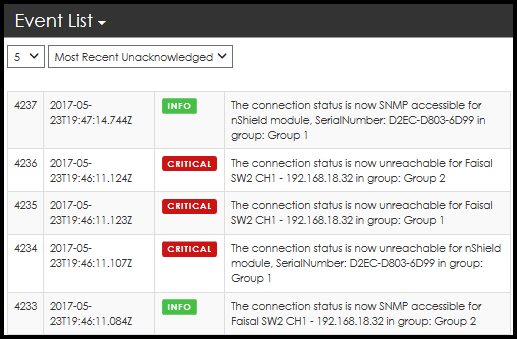
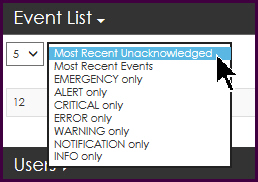
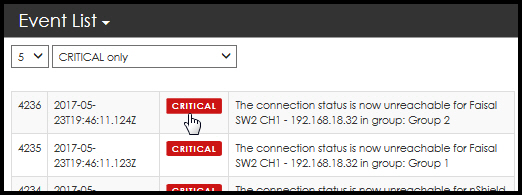
From this window, you can specify the number of events (default value is 5) displayed and filter according to:
-
Most Recent Unacknowledged (default value)
-
Most Recent Events
-
Alarm level (i.e., EMERGENCY ONLY, ALERT ONLY, etc.)
-
-
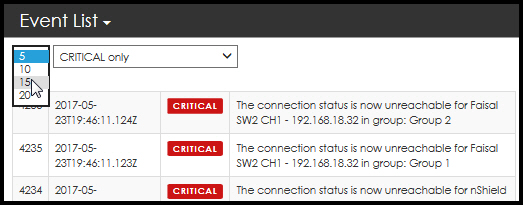
Select the drop down arrow to expand your choices for number of events displayed.
-
Select your preference.
-
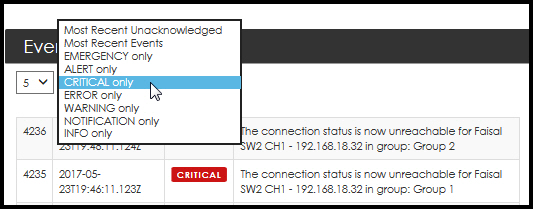
Select the drop down arrow to expand your choices for event types.
-
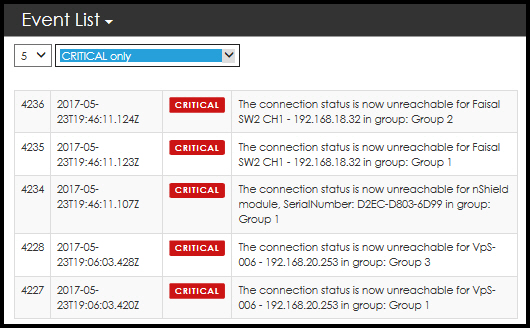
Select your preference, e.g. CRITICAL only.
-
Select the event by clicking on the event type.
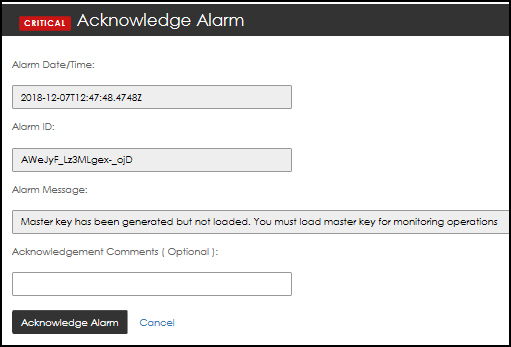
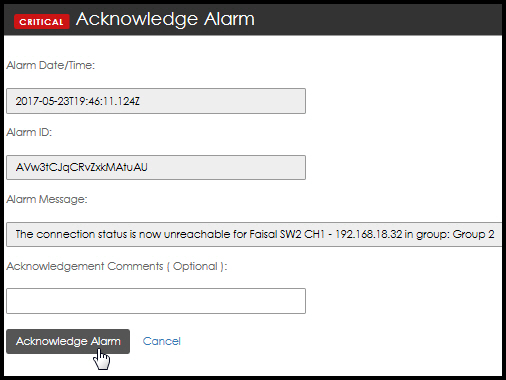
The Acknowledge Alarm page opens:
-
Enter Acknowledgment Comments, if needed.
-
Select Acknowledge Alarm.
Selecting Cancel returns you to the Dashboard.
nShield Performance
| You are logged in as a Group Manager. |

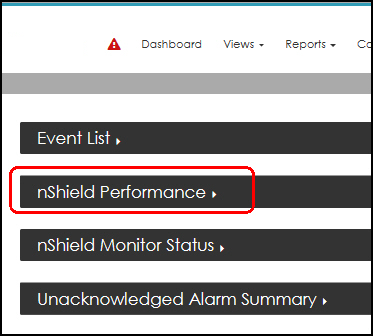
-
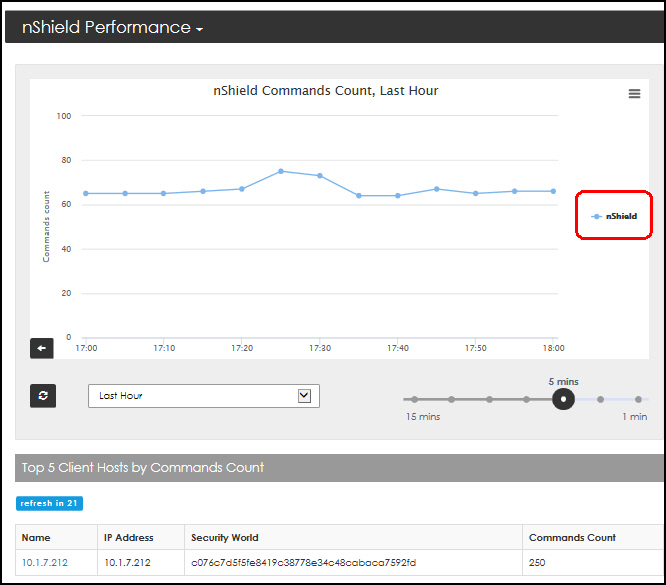
Select the nShield Performance expansion arrow. Two windows open:
-
nShield Performance
-
Top 5 Client Hosts by Command Count
-
nShield Performance window
The performance window provides a customizable graph.
This section provides a basic overview on how to use the customization options. Refer to Client Host Detail Page for greater detail.
Navigate to a Group’s Detail page
At any time, you can open a specific group’s Detail page. A color key on the right side of the graph contains Group color line assignments, e.g., "nShield" group - circled in red above.
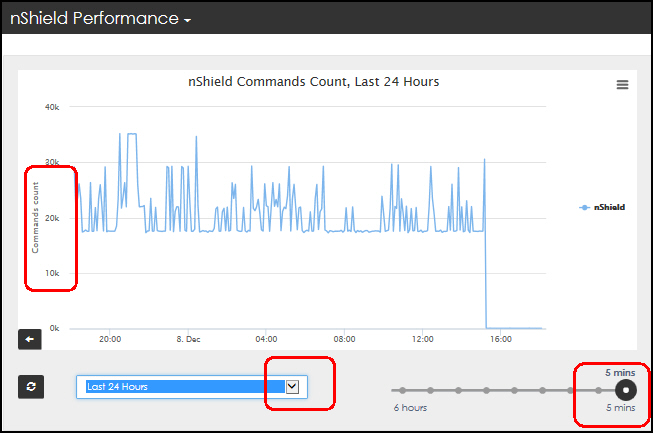
Clicking on Group 1’s graph contents opens the Group Detail For: Group 1 page.
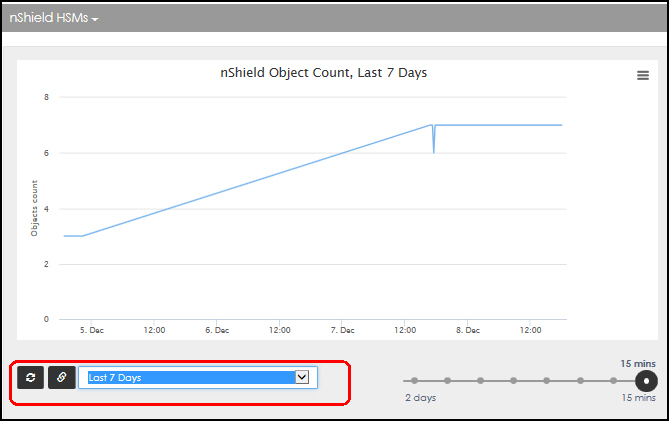
Refer to Group Details for a full description of the Group Details page.
Top 5 Client Hosts by Commands Count
This window also contains a live count down until the next refresh. In the example below, the data will refresh in 24 seconds.

-
Select an entry in the name list to navigate to additional windows of data.
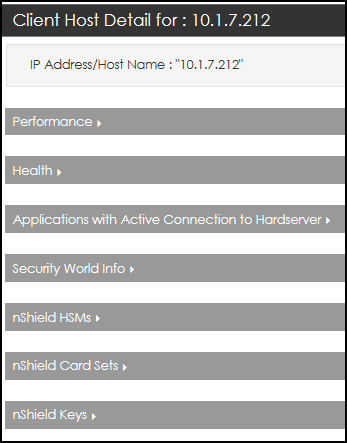
The detail page opens.
-
Select (i.e., click on) the Performance expansion arrow.
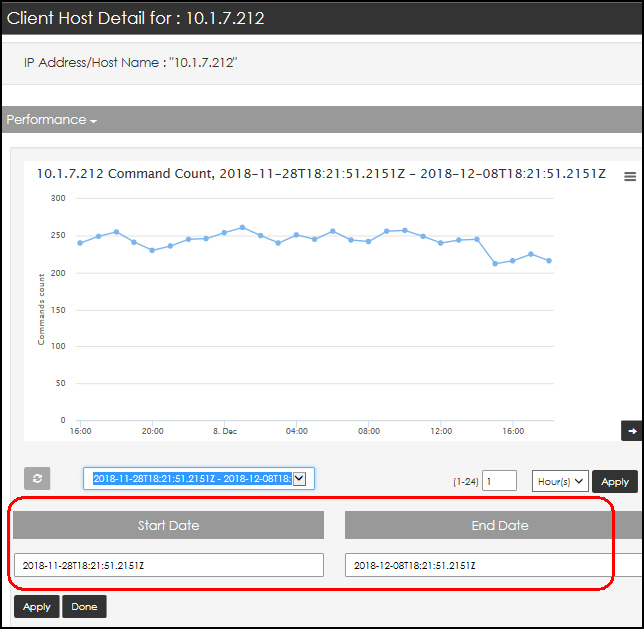
The Start Date and End Date selection boxes appear when the custom date option is selected.
-
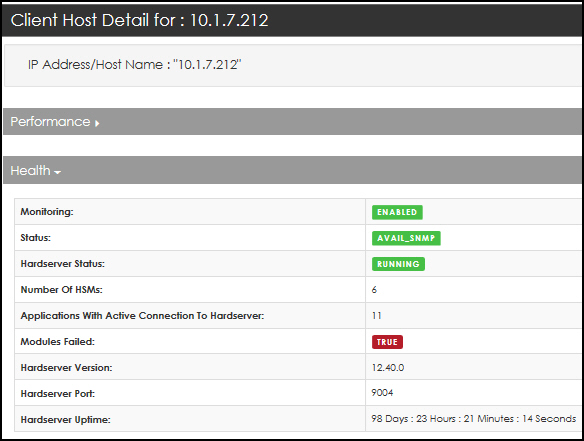
Scroll down and click on the Health expansion arrow.
-
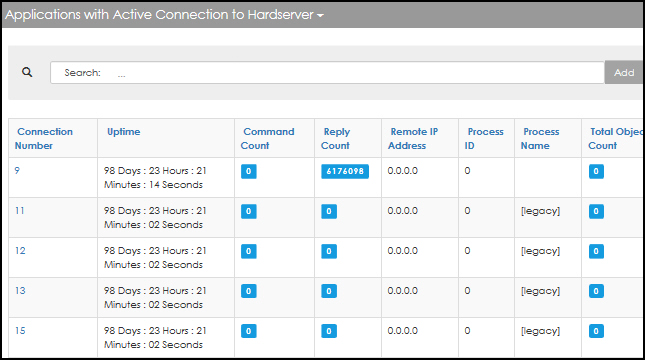
Scroll down and click on the Applications with Active Connection to Hardserver expansion arrow.
-
Scroll down and click on the Security World Info expansion arrow.

-
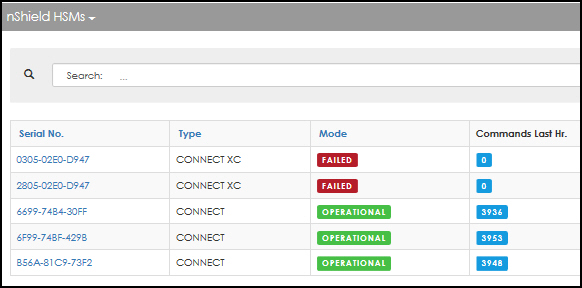
Scroll down and click on the nShield HSMs expansion arrow.
-
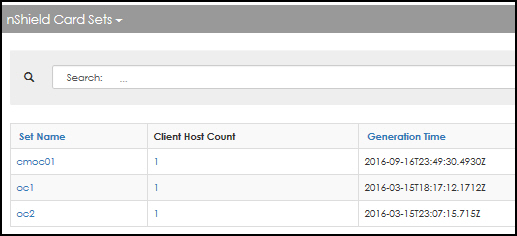
Scroll down and click on the nShield Card Sets expansion arrow.
-
Scroll down and click on the nShield Keys expansion arrow.
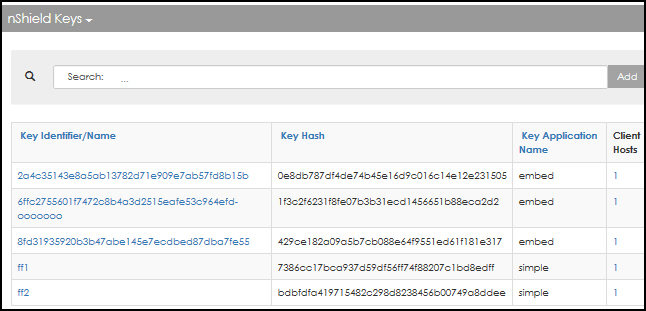
At any time, you can select Back to Previous Page.
Users
| You are logged in as an Administrator. |
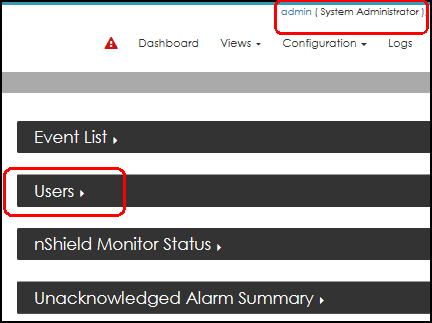
-
Click the Users expansion arrow.
-
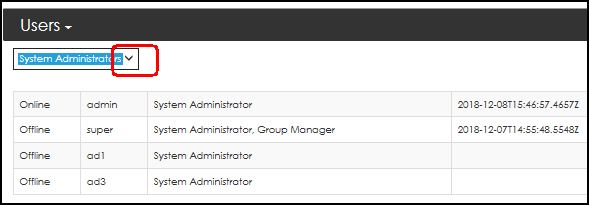
Select the drop down arrow to open the filtering options.
-
Select your preferred view. Filters include:
-
System Administrators
-
Group Managers
-
System Auditors
-
Last 5 login
-
Locked Out
-
The display reflects your selected filter option.
nShield Monitor Status
| You are logged in as an Administrator. |
-
Select the nShield Monitor Status expansion arrow.
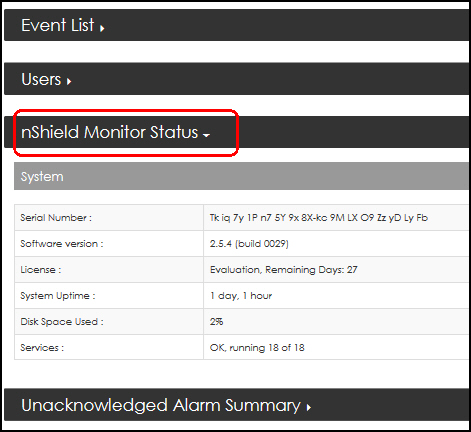
The status data is displayed.
Unacknowledged Alarm Summary
| You are logged in as an Administrator. |
-
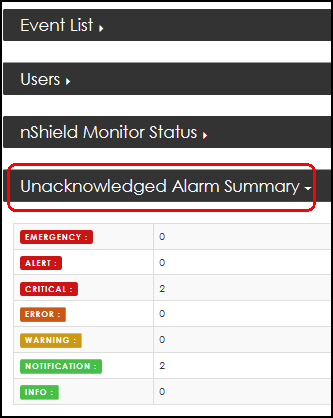
Scroll down, if needed, and select the nUnacknowledged Alarm Summary expansion arrow.
-
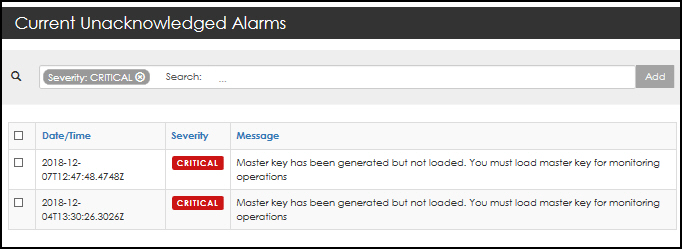
Select the alarm type, e.g., click on CRITICAL. The Current Unacknowledged Alarms detail page opens.
-
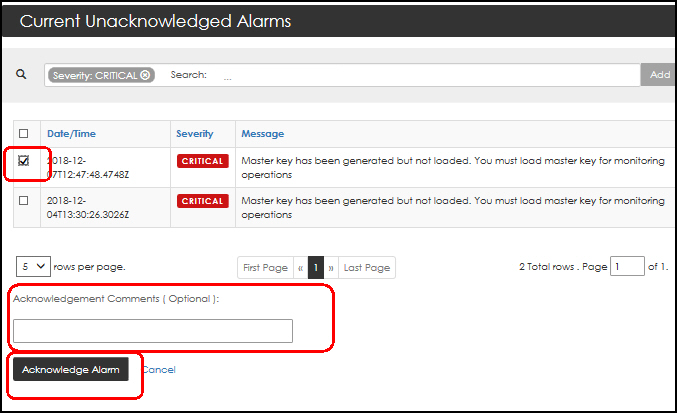
Select the alarm for acknowledgment.
-
Enter Acknowledgment Comments, if needed.
-
Select Acknowledge Alarm.
From the Current Unacknowledged Alarms window, you can also click on the severity type (e.g., click on CRITICAL), to open the Acknowledge Alarm window. 