Troubleshoot
Troubleshoot the installation
-
SSH to the EDM virtual machine.
> ssh sysadmin@xxx.xxx.xxx.xxx
Authorized uses only. All activity may be monitored and reported.
sysadmin@10.194.148.51's password:
X11 forwarding request failed on channel 0
Last login: Thu May 22 23:03:33 2025 from 172.28.4.43
[sysadmin@timestamping-auth-edm ~]$
-
The logs are available at:
[sysadmin@timestamping-auth-edm entrust]$ ls -al /var/log/entrust/
total 4
drwxr-xr-x.  4 root root   28 May  9 13:39 .
drwxr-xr-x. 15 root root 4096 May 22 11:26 ..
drwxr-xr-x.  2 root root  245 May  7 17:32 edm
drwxrwxrwx.  2 root root   24 May 14 13:58 tsa
Troubleshoot the configuration
-
On a web browser navigate to
https://<machine>/grafana, where <machine> is the EDM hostname or IP address. Log in as a user with Timestamping Authority management permissions, for example admin. -
Select the Dashboard.
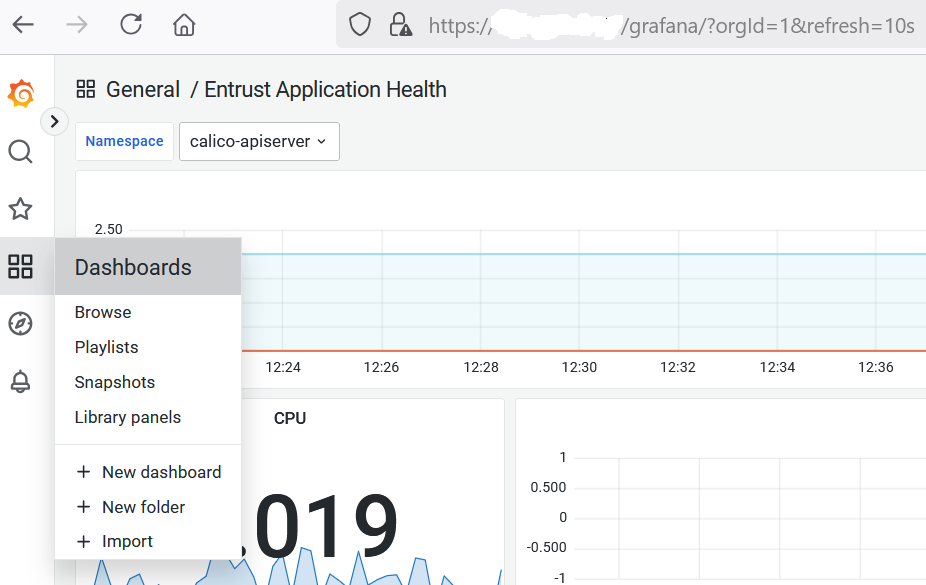
-
Type loki in the search bar and select Loki Dashboard quick search.
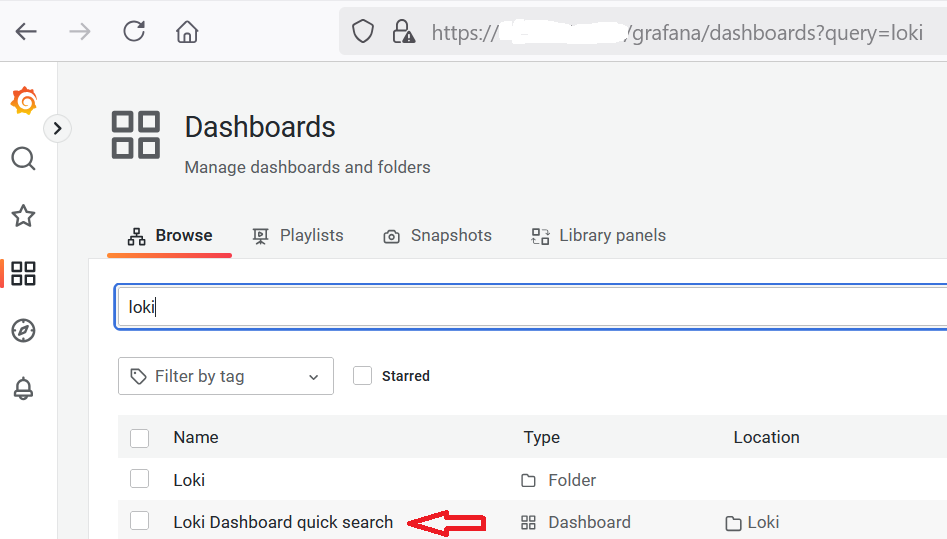
-
In the namespace select tsa.
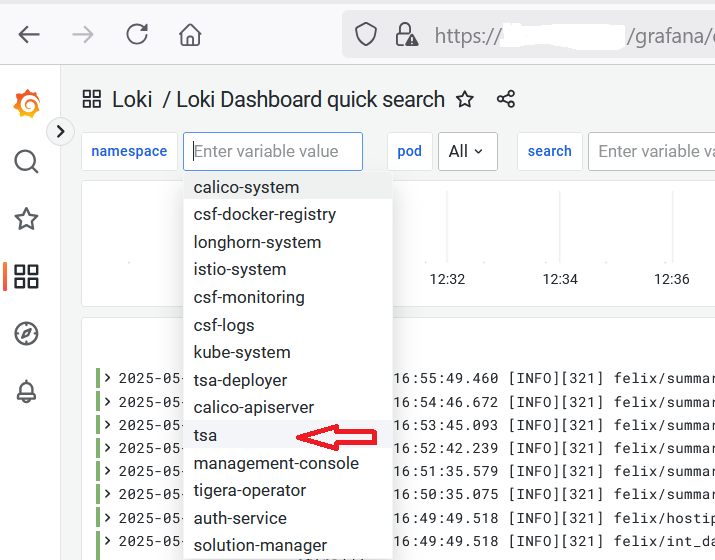
-
The log is now visible in the Logs Panel. Use the scroll bars and the Refresh dashboard icon on the top right to navigate the log.