Troubleshooting
This appendix describes nShield Monitor troubleshooting information.
Global Troubleshooting Enhancement feature
Overview
HSMs, nShield Monitor (NM) Servers, and nShield Monitor users can be globally dispersed crossing multiple time zones. nShield Monitor stores all collected HSM events in Greenwich Mean Time (also referred to as nShield Monitor Server time). Users who remotely log into nShield Monitor see NM information displayed in the local time zone of their browser.
The Global Troubleshooting Enhancement feature allows nShield Monitor users in various time zones, to select and view nShield Monitor Log and Alarms in a common Timezone. This ability is helpful during global troubleshooting discussions.
Procedure
Prerequisite:
You are logged into nShield Monitor.
| Just for the duration of a special global collaboration work-session, a logged in user can choose a SELECTED time zone for viewing Logs and Alarms on their browser connected to nShield Monitor. |
-
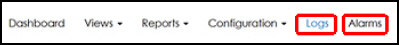
Navigate to either the Logs tab or the Alarms tab.
-
Go to the Date/Time drop down.

-
Select your preferred time zone.
Notes:
-
The setting applies to both Alarms and Logs tabs. That is, you only have to select the time zone once.
-
ONLY the time zone displayed in these two tabs will be affected by this selection (nShield Monitor displays on the other nShield Monitor tabs are NOT affected).
-
The default time zone in Logs and Event pages are browser 'Local Time' unless the Date/Time Format is set to UTC in User Profile, and in such case, the default time zone is GMT.
-
The time zone change is NOT persisted across user logout/login. The time zone change is temporary. The next time that you login, the time zone is reset to the default 'Local Time' which is the default (or UTC if the Date/Time Format is UTC in the login User Profile).
-
The Time Zone customization in Logs/Alarms pages does NOT affect Date/Time in other WebUI pages, including Charts, Export Logs, and so on. All other WebUI pages display Date/Time in 'Local Time' Time Zone (or UTC if the Date/Time Format is UTC in the login User Profile).
Network test tools
Event logs provide additional information about security and operations issues.
The following networking test tools are available through the CLI to facilitate nShield Monitor inter-networking tests.
-
Ping
-
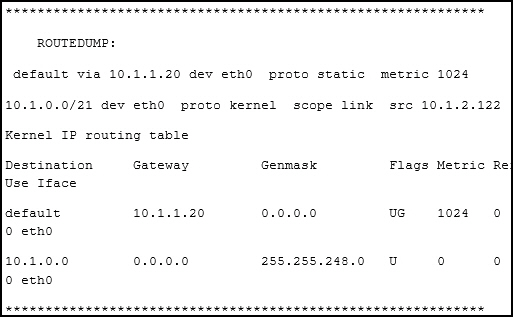
RouteDump
-
TCPDump
-
Traceroute
To run the nShield Monitor Network test tools:
-
Log into the CLI as an Administrator.
-
Enter the command:
troubleshoot -
Press Enter or Tab to display available options as follows:
nShield Montor > troubleshoot ping routedump tcpdump traceroute nShield Monitor > troubleshoot -
Type one of the four options to run the appropriate test tool.
Ping
Ping is a pass-fail continuity test that determines the accessibility of a target IP address on an IP network. It sends ICMP echo request packets from the selected nShield Monitor Management Interface to the specified target IP address and waits for an ICMP response.
Using Ping
-
Log into the CLI as an Administrator.
-
Enter the command:
troubleshoot ping <Hostname or IP Address to ping> -
Press Enter.
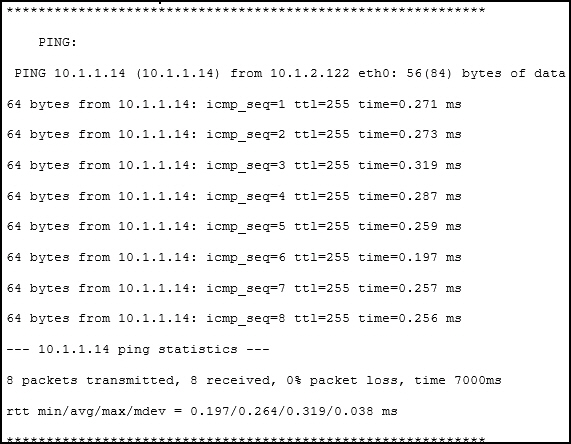
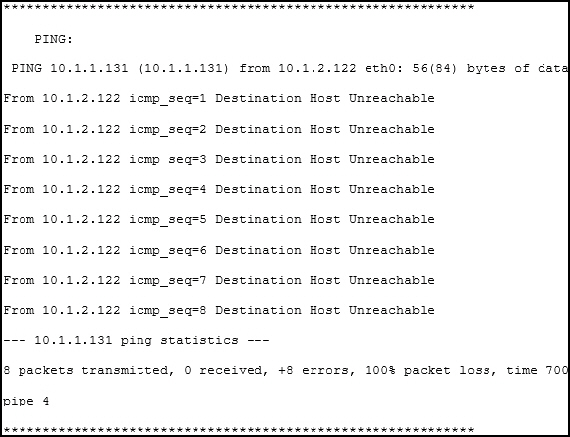
Ping output is displayed directly on the CLI screen. If the ping returns successfully, the network statistics and properties display appear. If the ping does not return, a failure message appears.
Example: Success case
Example: Not Successful
TCPDump
TCPDump is a common packet analyzer. It enables users to intercept and display TCP/IP and other packets being transmitted/received over a network to which the computer is attached.
Using the CLI commands tcpdump on and tcpdump off, the utility can be turned on and off.
Using TCPDump
-
Log into the CLI as an Administrator.
-
Turn on TCPDump.
-
Enter the command:
troubleshoot tcpdump on -
Press Enter.
The utility starts capturing.
Each Interface TCPDump capture generates a trace file. The TCPDump trace file can only be exported as part of exporting debug logs.
Restarting the TCPDump capture overwrites any previously captured data.
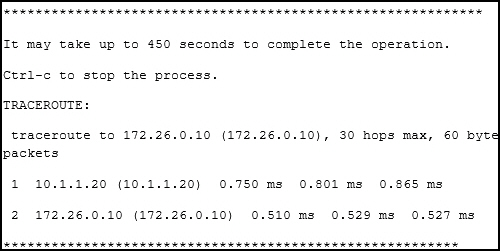
Traceroute
Traceroute determines network response time, displays route (path) information from an IP source to an IP destination address, and measures the associated transit delays of packets across the network. It operates by sending a sequence of ICMP packets from a specified source IP address to a specified destination IP address, and uses responses to determine the intermediate routers traversed.